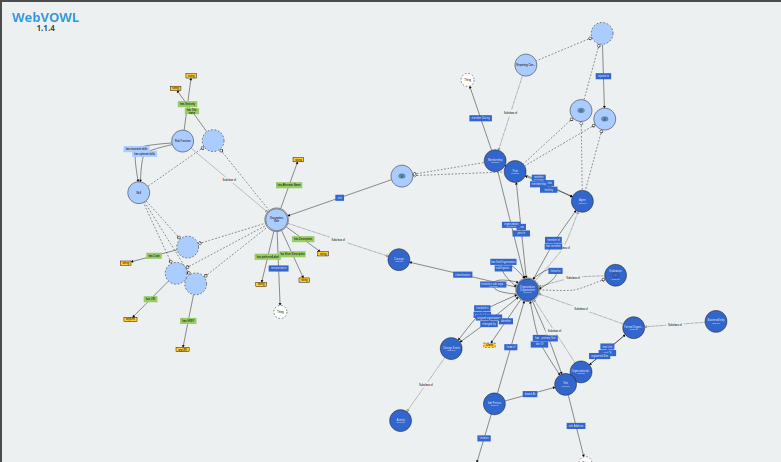
Non-Performing Loan Ontology
The NPL Ontology (NPLO) is a new ontology describing datasets of Non-Perfoming Loan Portfolios.

The Non-Perfoming Loan Ontology
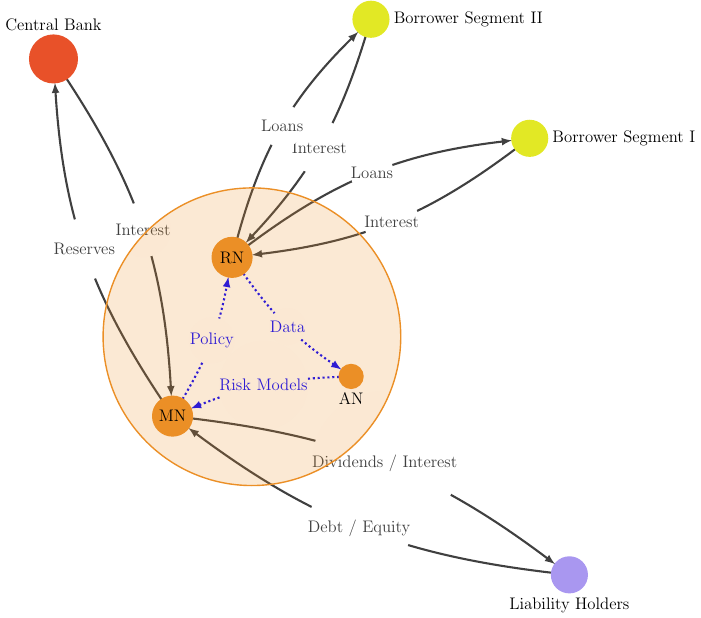
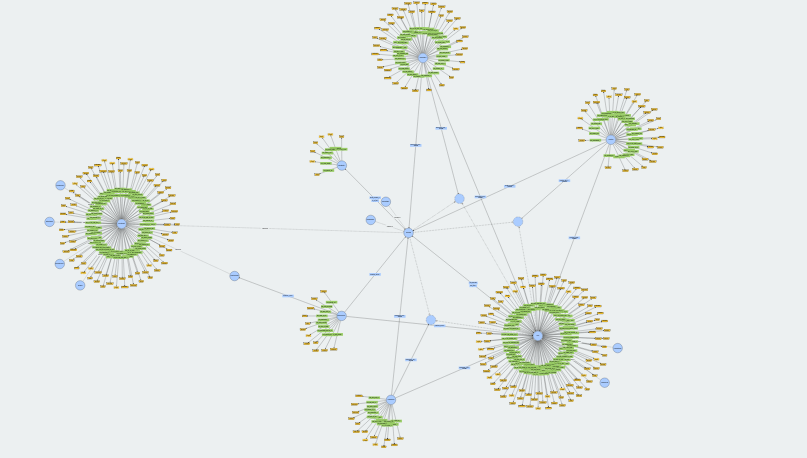
The Non-Performing Loan Ontology is a framework that aims to represent and categorize knowledge about non-performing loans using semantic web information technologies. Codenamed NPLO, it codifies the relationship between the various components of a Non-Performing Loan portfolio dataset.(NB: Non-performing loans are bank loans that are 90 days or more past their repayment date or that are unlikely to be repaid, for example if the borrower is facing financial difficulties).