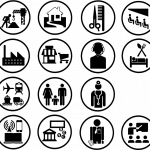
NACE Economic Activity Pictograms
Representing economic activity using pictograms
Visualization can produce significant new insights when applied to quantitative data. It is currently undergoing a renaissance that mirrors other developments in computing and data science. Sophisticated open source libraries such as d3.js or matplotlib, to name but a couple, are enabling an ever wider range of users to distill valuable information from the avalanche of data being produced.